
Married…To Be, Or Not To Be?
Avg. age men (28) & women (26) first marry – highest ever recorded

Married…To Be, Or Not To Be
Gender Roles They are a-Changin’
We are FAMILY Too!
• 2010, 650,000 Same-sex couple housholds lived in US
• 2010, 111,000 Same-sex couples had children
• 8,200,000 people self identified as LGBT in the US
• Around 3,000,000 LGBT adults have had a child
• May 14, 2013 Minnesota officially became the 12th US State to approve same-sex marriage
• States with the highest proportion of same-sex couples raising biological, adopted, or step-children
o Montana, Idaho, Wyoming, North Dakota, South Dakota, Kansas, Oklahoma, Arkansas, Mississippi, and Alaska (Source: Gates, G.J. (2013): LGBT Parenting in the US. The Williams Insitute, UCLA Law School
ADOPTING a New Outlook on Family
• 1944, 50,000 adoptions
• By 2008, 135,813 children were adopted annually in the US
• From 1944-2008 there was a 172% increase in adoptions
• 15% increase in adoptions since 1990; 6% increase since 2000
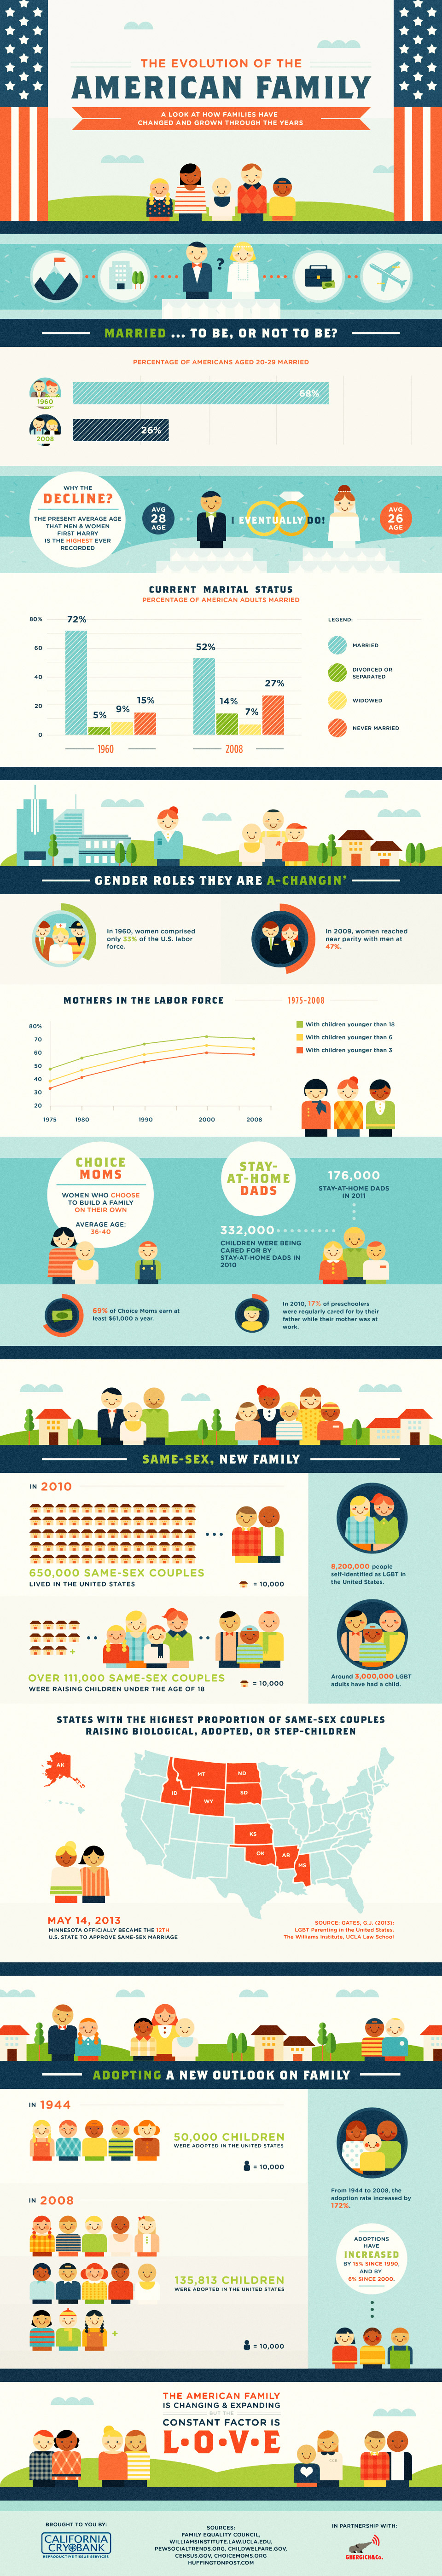
The Evolution of the American Family – Brought To You By California Cryobank
Sources


Leave a Reply
You must be logged in to post a comment.